Alternatives to Plotly

Research overview

10 alternatives

  1. 1Build and publish interactive dashboards and analytics applications for team collaboration

    Looker

    Data Visualization

    Both Plotly and Looker serve as BI platforms enabling dashboard creation and analytics publishing. Looker emphasizes semantic layers and enterprise governance, while Plotly focuses on code-backed analytics with AI agents. Plotly's open-source foundation and developer-friendly approach differs from Looker's LookML-centric model, making them partial substitutes for different team compositions.

    Free planFree trialReal-Time AnalyticsEmbedded Analytics
    Vendor sources: plotly.com [1]looker.com [2]

    Last verified
  2. 2Enable self-service analytics and dashboard creation for business teams

    Metabase

    Business Intelligence (BI)

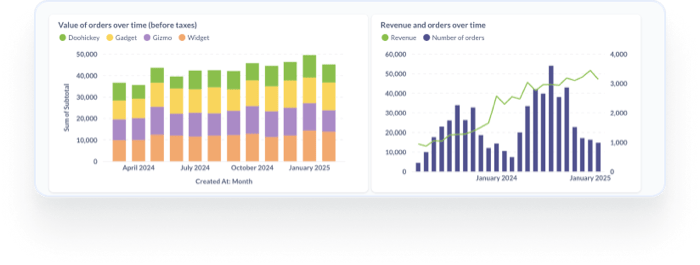
    Both Plotly and Metabase provide self-service BI capabilities with AI-assisted analytics. Metabase emphasizes ease-of-use and open-source accessibility, while Plotly offers deeper Python integration and agentic AI. They compete for similar use cases but appeal to different technical skill levels.

    Free planFree trialSOC 2GDPRCCPATiered plans

    Vendor sources: plotly.com [1]metabase.com [2]

    Last verified
  3. 3Create and share interactive dashboards with business teams

    Klipfolio

    Business Intelligence (BI)

    Both Plotly and Klipfolio enable dashboard creation and sharing. Klipfolio emphasizes ease-of-use and pre-built integrations, while Plotly offers deeper customization and developer capabilities. They serve overlapping but distinct market segments.

    Free trialTiered plansReal-Time AnalyticsCampaign Performance Tracking

    Price$99+ / month

    Starting price: above the category median.

    Vendor sources: plotly.com [1]klipfolio.com [2]

    Last verified
  4. 4Business Intelligence (BI), Data Visualization

    Redash

    Business Intelligence (BI)

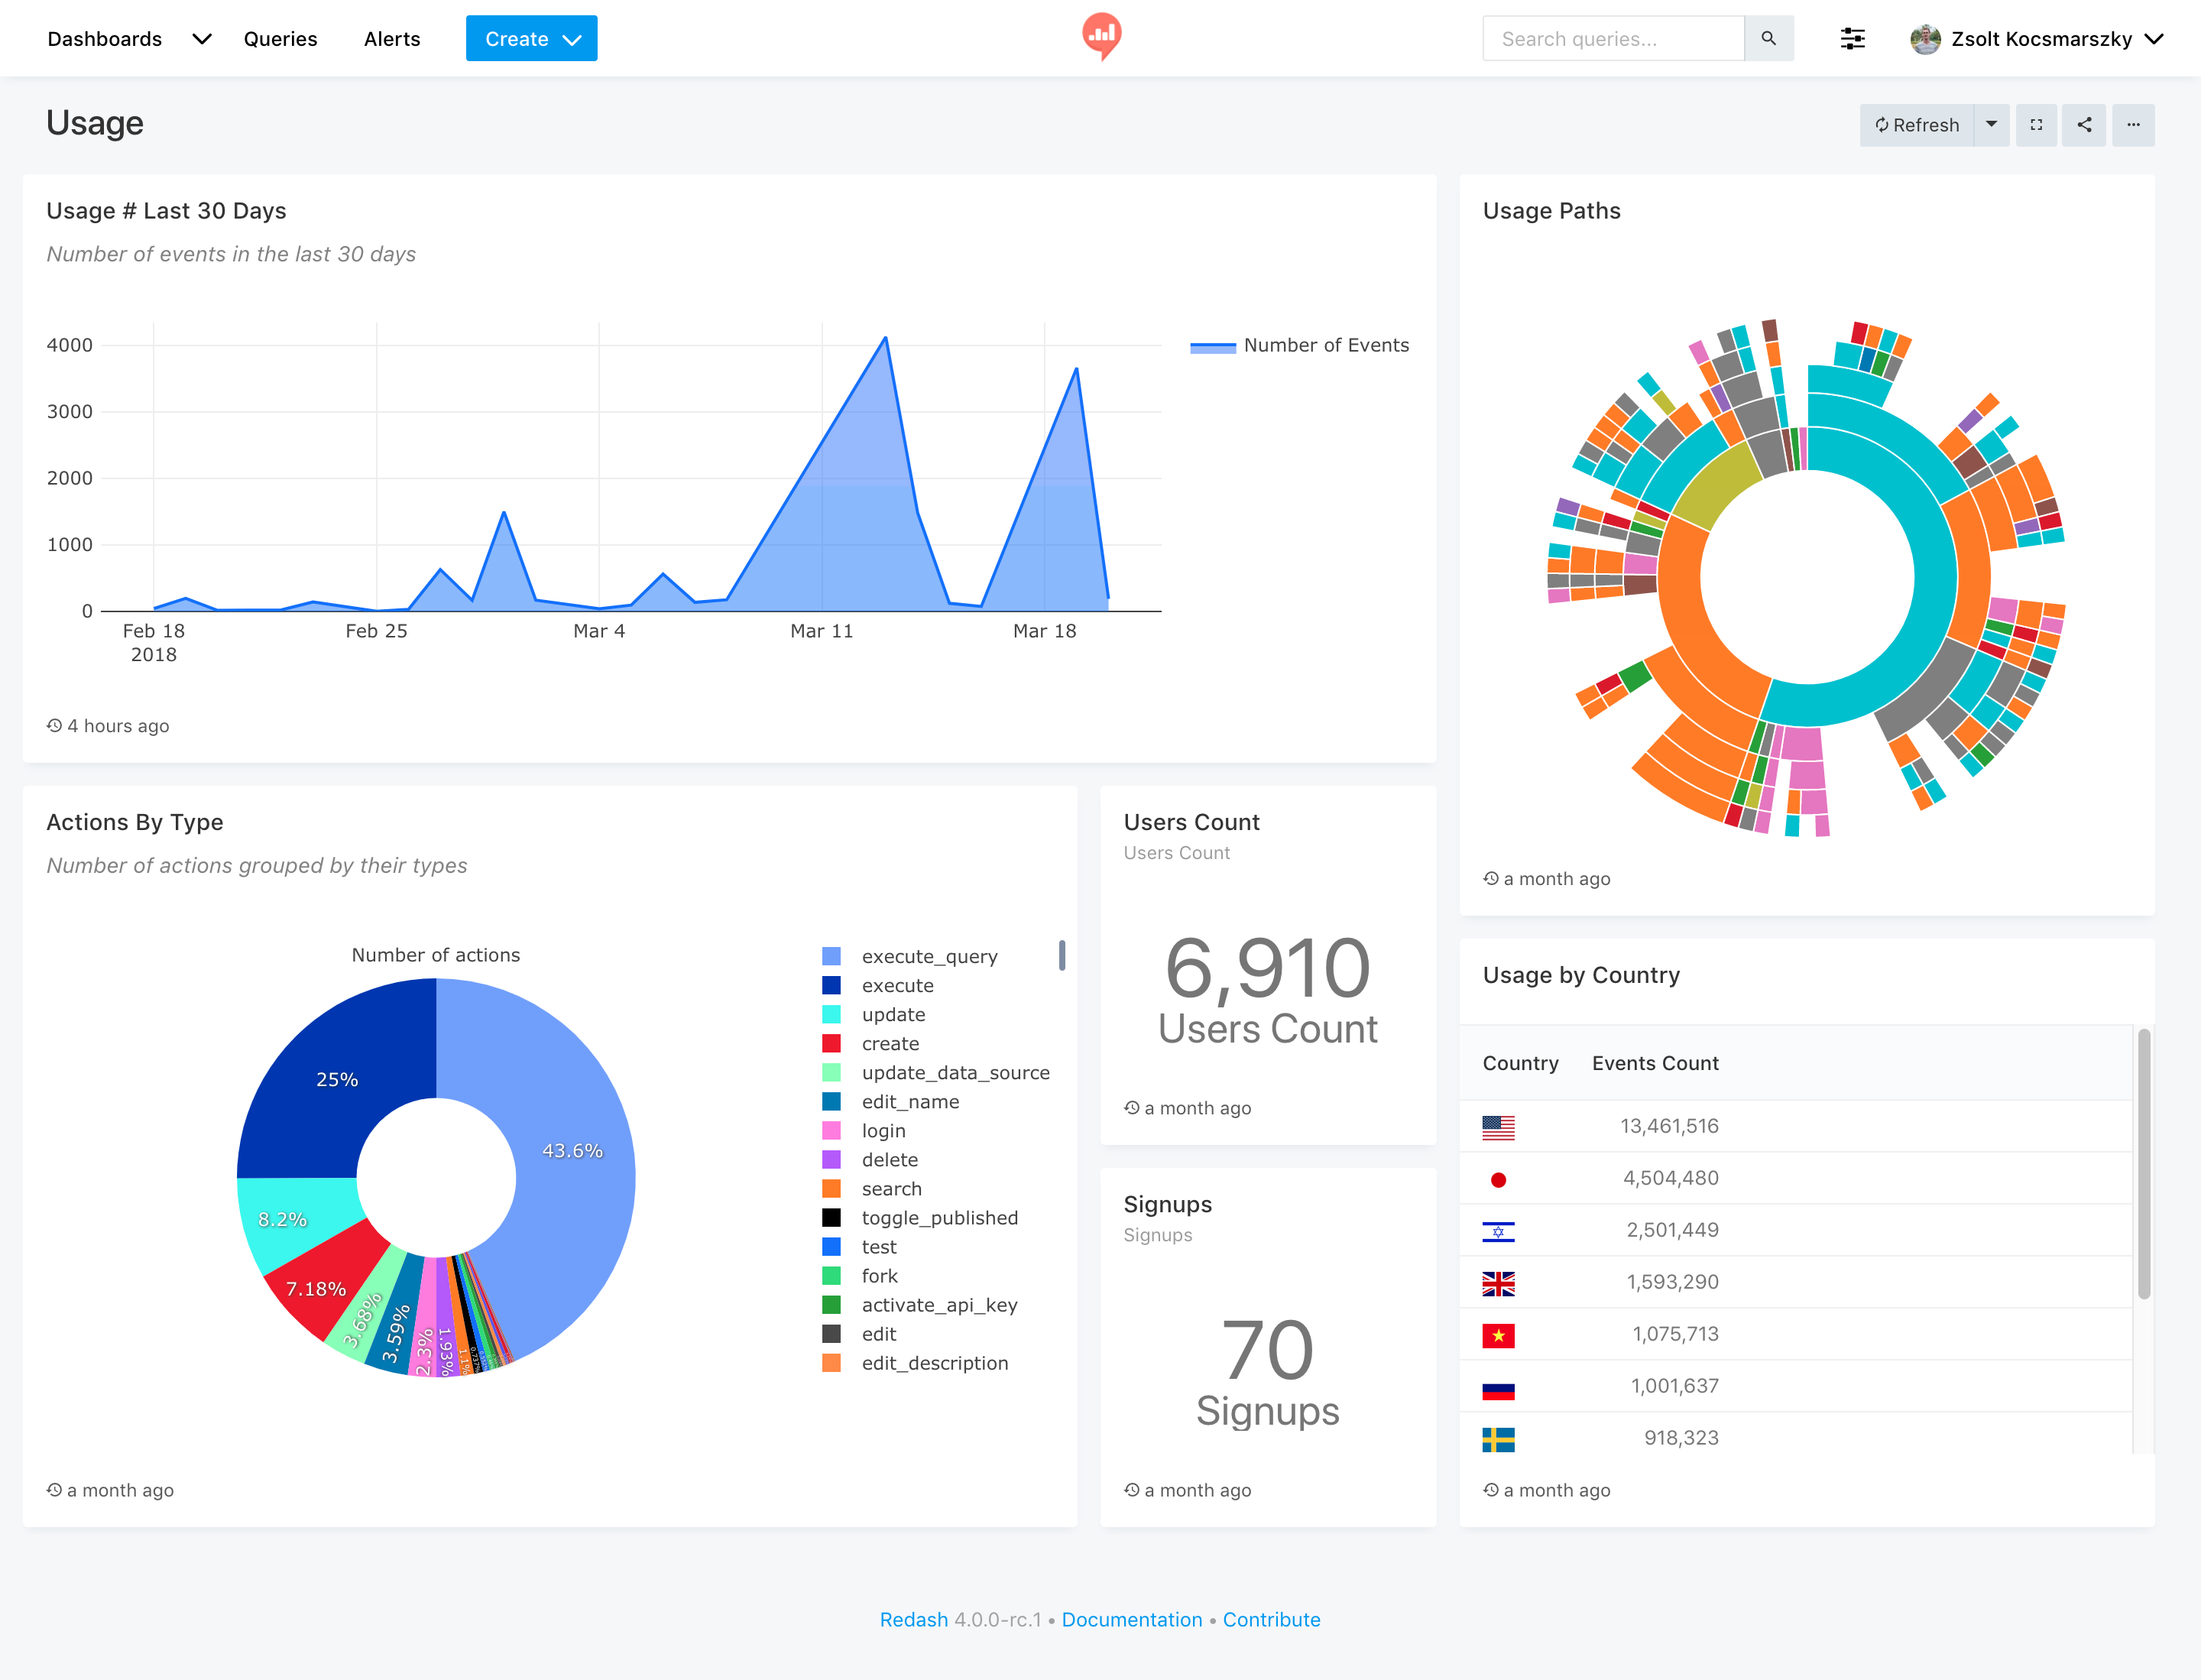
    Redash is an open-source data visualization and dashboarding platform that connects to any data source and enables teams to query, visualize, and share data insights.

    Query snippets and reusable components
  5. 5Business Intelligence (BI), Data Visualization

    Observable

    Data Visualization

    Collaborative data visualization platform for building interactive notebooks, dashboards, and data apps.

    Free planFree trialSOC 2Tiered plansReal-Time AnalyticsBusiness Intelligence (BI)

    Price$22+ / seat / month

    Starting price: above the category median.
  6. 6Business Intelligence (BI), Data Visualization

    Count

    Business Intelligence (BI)

    Count is a collaborative data notebook that combines SQL, Python, and visualization in an interactive canvas for data analysis, exploration, and reporting.

    Free planFree trialSOC 2GDPRHIPAATiered plans
  7. 7Data Visualization

    Streamlit

    Data Visualization

    Open-source Python framework by Snowflake for building and sharing data science web applications quickly.

    Free planFree trialSOC 2ISO 27001Data AnalysisData Scientist
  8. 8Business Intelligence (BI)

    Matomo

    Business Intelligence (BI)

    Matomo is an open-source web analytics platform that provides complete data ownership, privacy compliance, and detailed analytics as a self-hosted or cloud alternative to Google Analytics.

    Free planFree trialTiered plansCloud HostingWeb Analytics
  9. 9Data Visualization

    Taipy

    Data Pipeline Orchestration

    Open-source Python framework for building data-driven web applications and pipelines.

    Scenario managementDistributed computingLow code gui builder
  10. 10Business Intelligence (BI), Self-Service Analytics

    Lightdash

    Business Intelligence (BI)

    Lightdash is an open-source BI tool built for dbt users that turns dbt metrics into beautiful dashboards and self-serve analytics for data teams.

    Free planFree trialSOC 2HIPAATiered plansAI Agents