 Cubbie Points
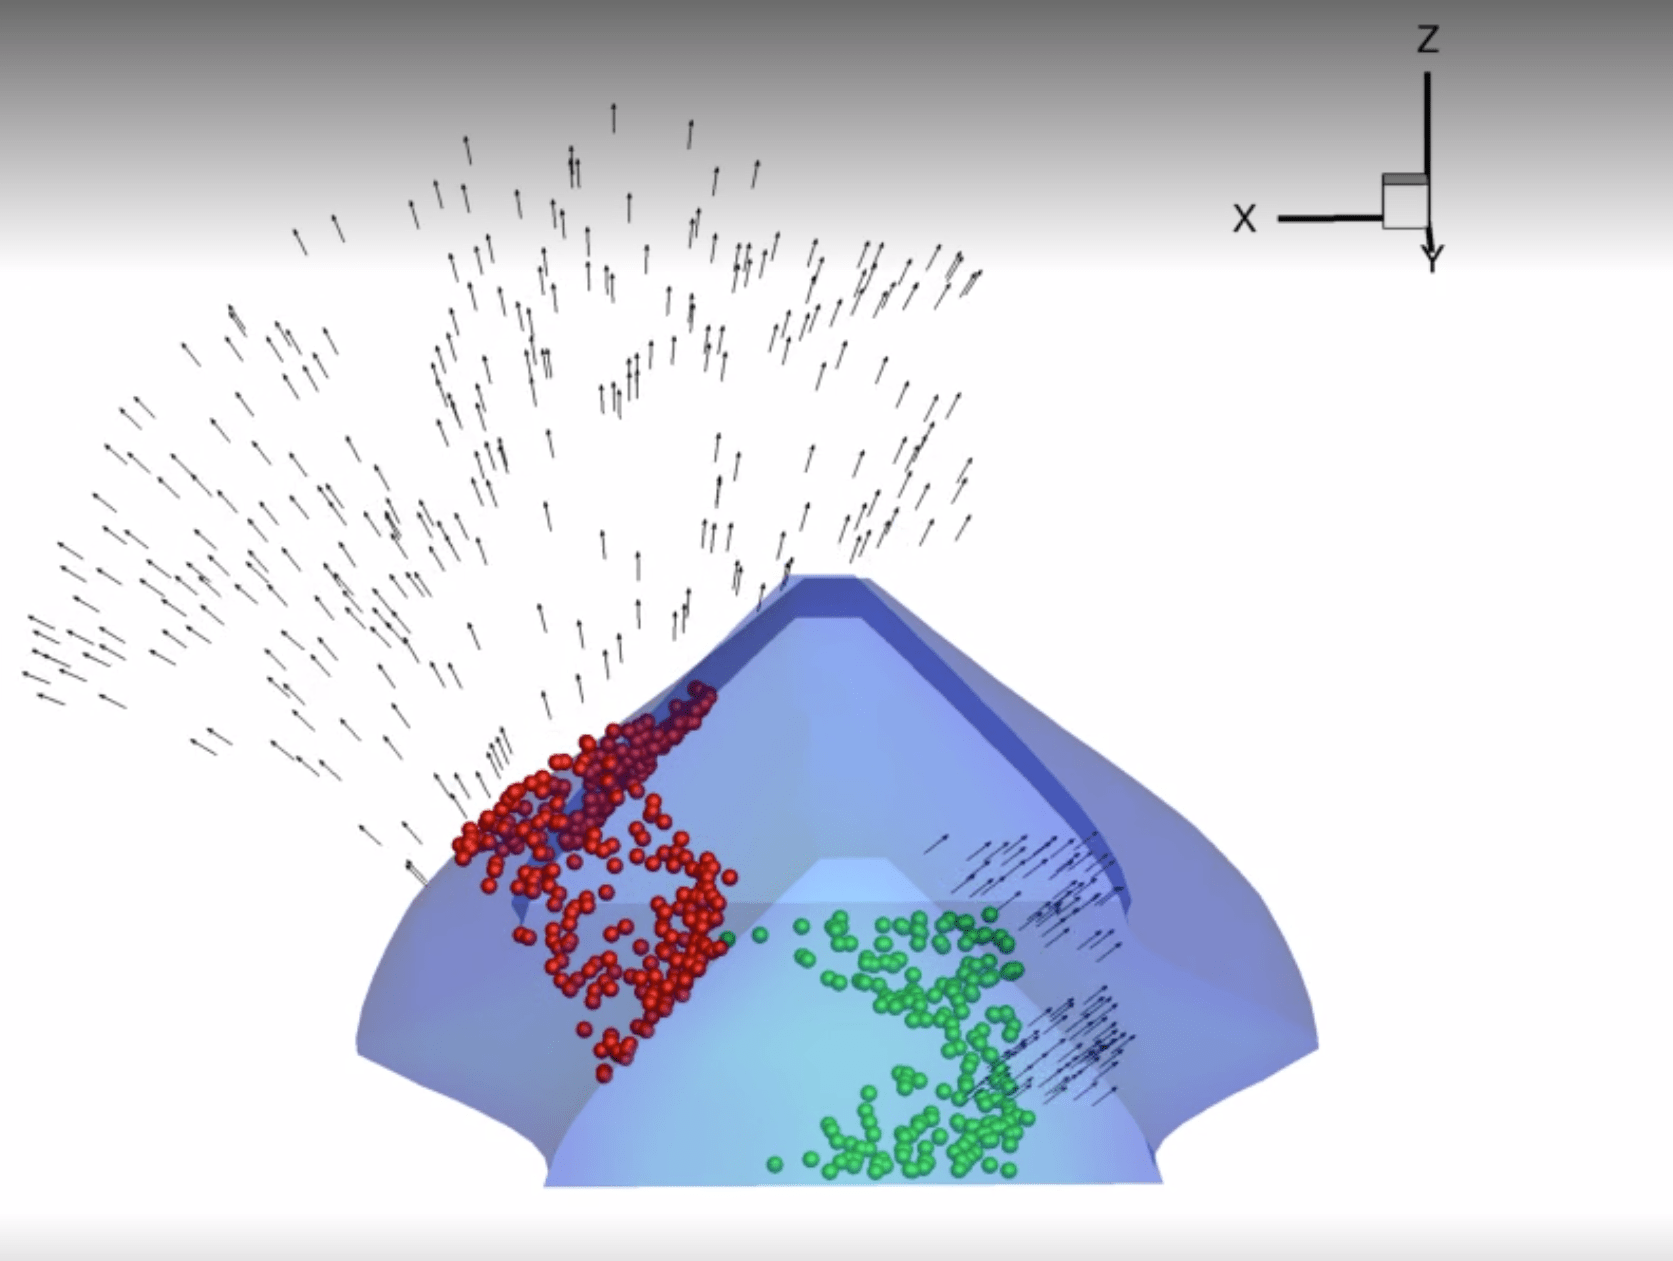

Tecplot 360
Scientific Data Visualization
CFD post-processing and visualization tool used by aerospace, automotive, and energy engineers. Handles large-scale simulation results with scripting.
Free trialSimulation SoftwareData Scientists & Analysts
 What is the future of software?Take Survey
Scientific Data Visualization
CFD post-processing and visualization tool used by aerospace, automotive, and energy engineers. Handles large-scale simulation results with scripting.

Scientific Data Visualization
Dotmatics is a scientific informatics platform (now owned by Siemens) that provides ELN, LIMS, data visualization, biological registration, and statistical analysis tools. Its portfolio includes GraphPad Prism, SnapGene, Geneious, and other widely-used research software.

Oil and Gas Production Software
Deep learning interpretation software (InteractivAI) for subsurface geosciences in oil and gas.
Data Visualization
Open source graph visualization software for representing structural information.

Data Visualization Libraries
Interactive visualization library for Python creating versatile graphics for modern web browsers.
Data Visualization Libraries
D3.js is the leading JavaScript library for creating dynamic, interactive data visualizations in web browsers using SVG, Canvas, and HTML with a powerful data-binding approach.
Tax Management
Property tax and revenue management software for county treasurers and assessors.
Research Data Management
Bioinformatics software for genomic data exploration and biomarker discovery used in research and diagnostics labs.
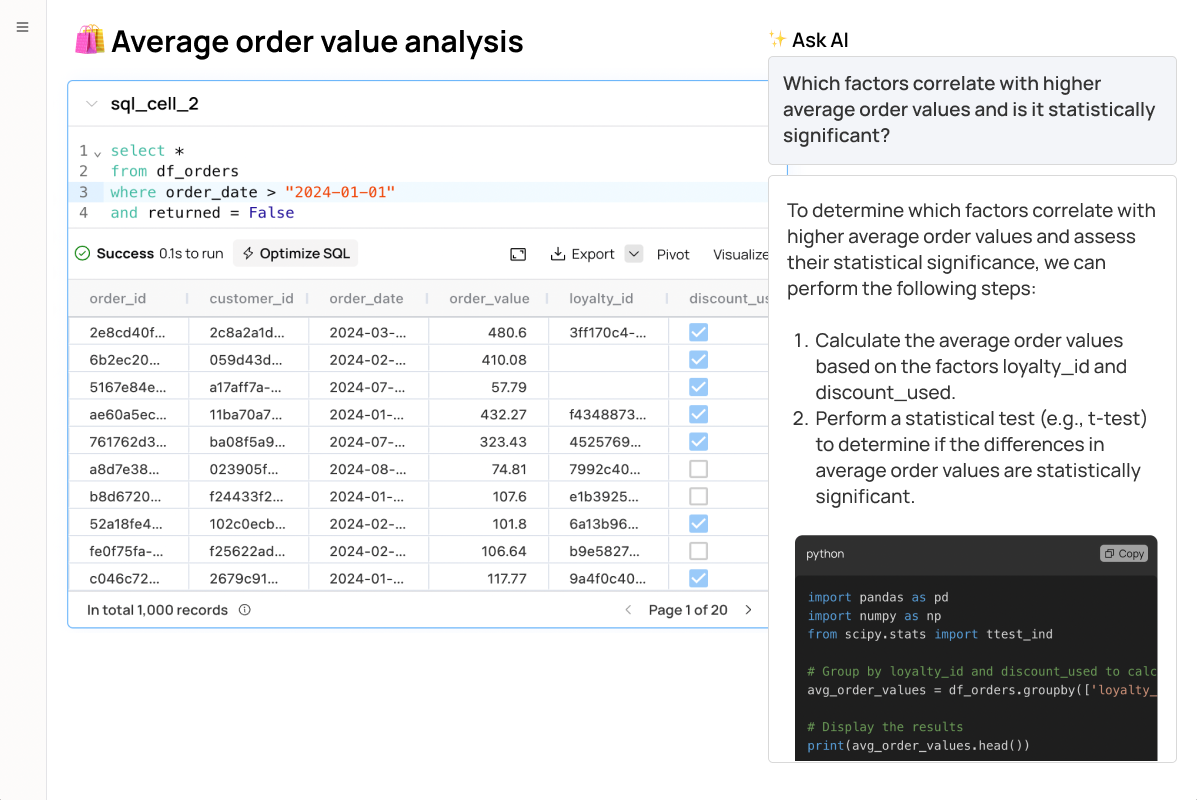
Business Intelligence (BI)
Fabi.ai provides an AI-native business intelligence platform that enables anyone to query databases, build dashboards, and get insights using natural language.
Price$39+ / seat / month
Starting price: below the category median.
Drug Discovery Platforms
AI-powered simulated cell platform for precision oncology that models cancer cell behavior to identify drug targets and biomarkers.